CanadaPost
Headquarters : Ottawa
Date of incorporation : 1861
Shipping experience Score : 83.6%


Intelcom
Headquarters : Montreal
Date of incorporation : 1986
Shipping experience Score : 96%
CanadaPost
Headquarters : Ottawa
Date of incorporation : 1861
Shipping experience Score : 83.6%
Intelcom
Headquarters : Montreal
Date of incorporation : 1986
Shipping experience Score : 96%
A Comprehensive Shipping Carrier Performance Evaluation Report
The year 2020 witnessed an unprecedented boom in eCommerce sales. Unfortunately it was accompanied by shipping carriers being clogged with an overwhelming package volume. This resulted in innumerable delivery issue creating rampant dissatisfaction amongst both the eCommerce businesses as well as the end customer.
As a consequence, retailers had to lose a vast majority of customers due to unexpected delivery exceptions or not delivering on their order-fulfillment commitment. At ShippingChimp, we are committed to offering ecommerce businesses complete visibility into shipping carrier’s performance.
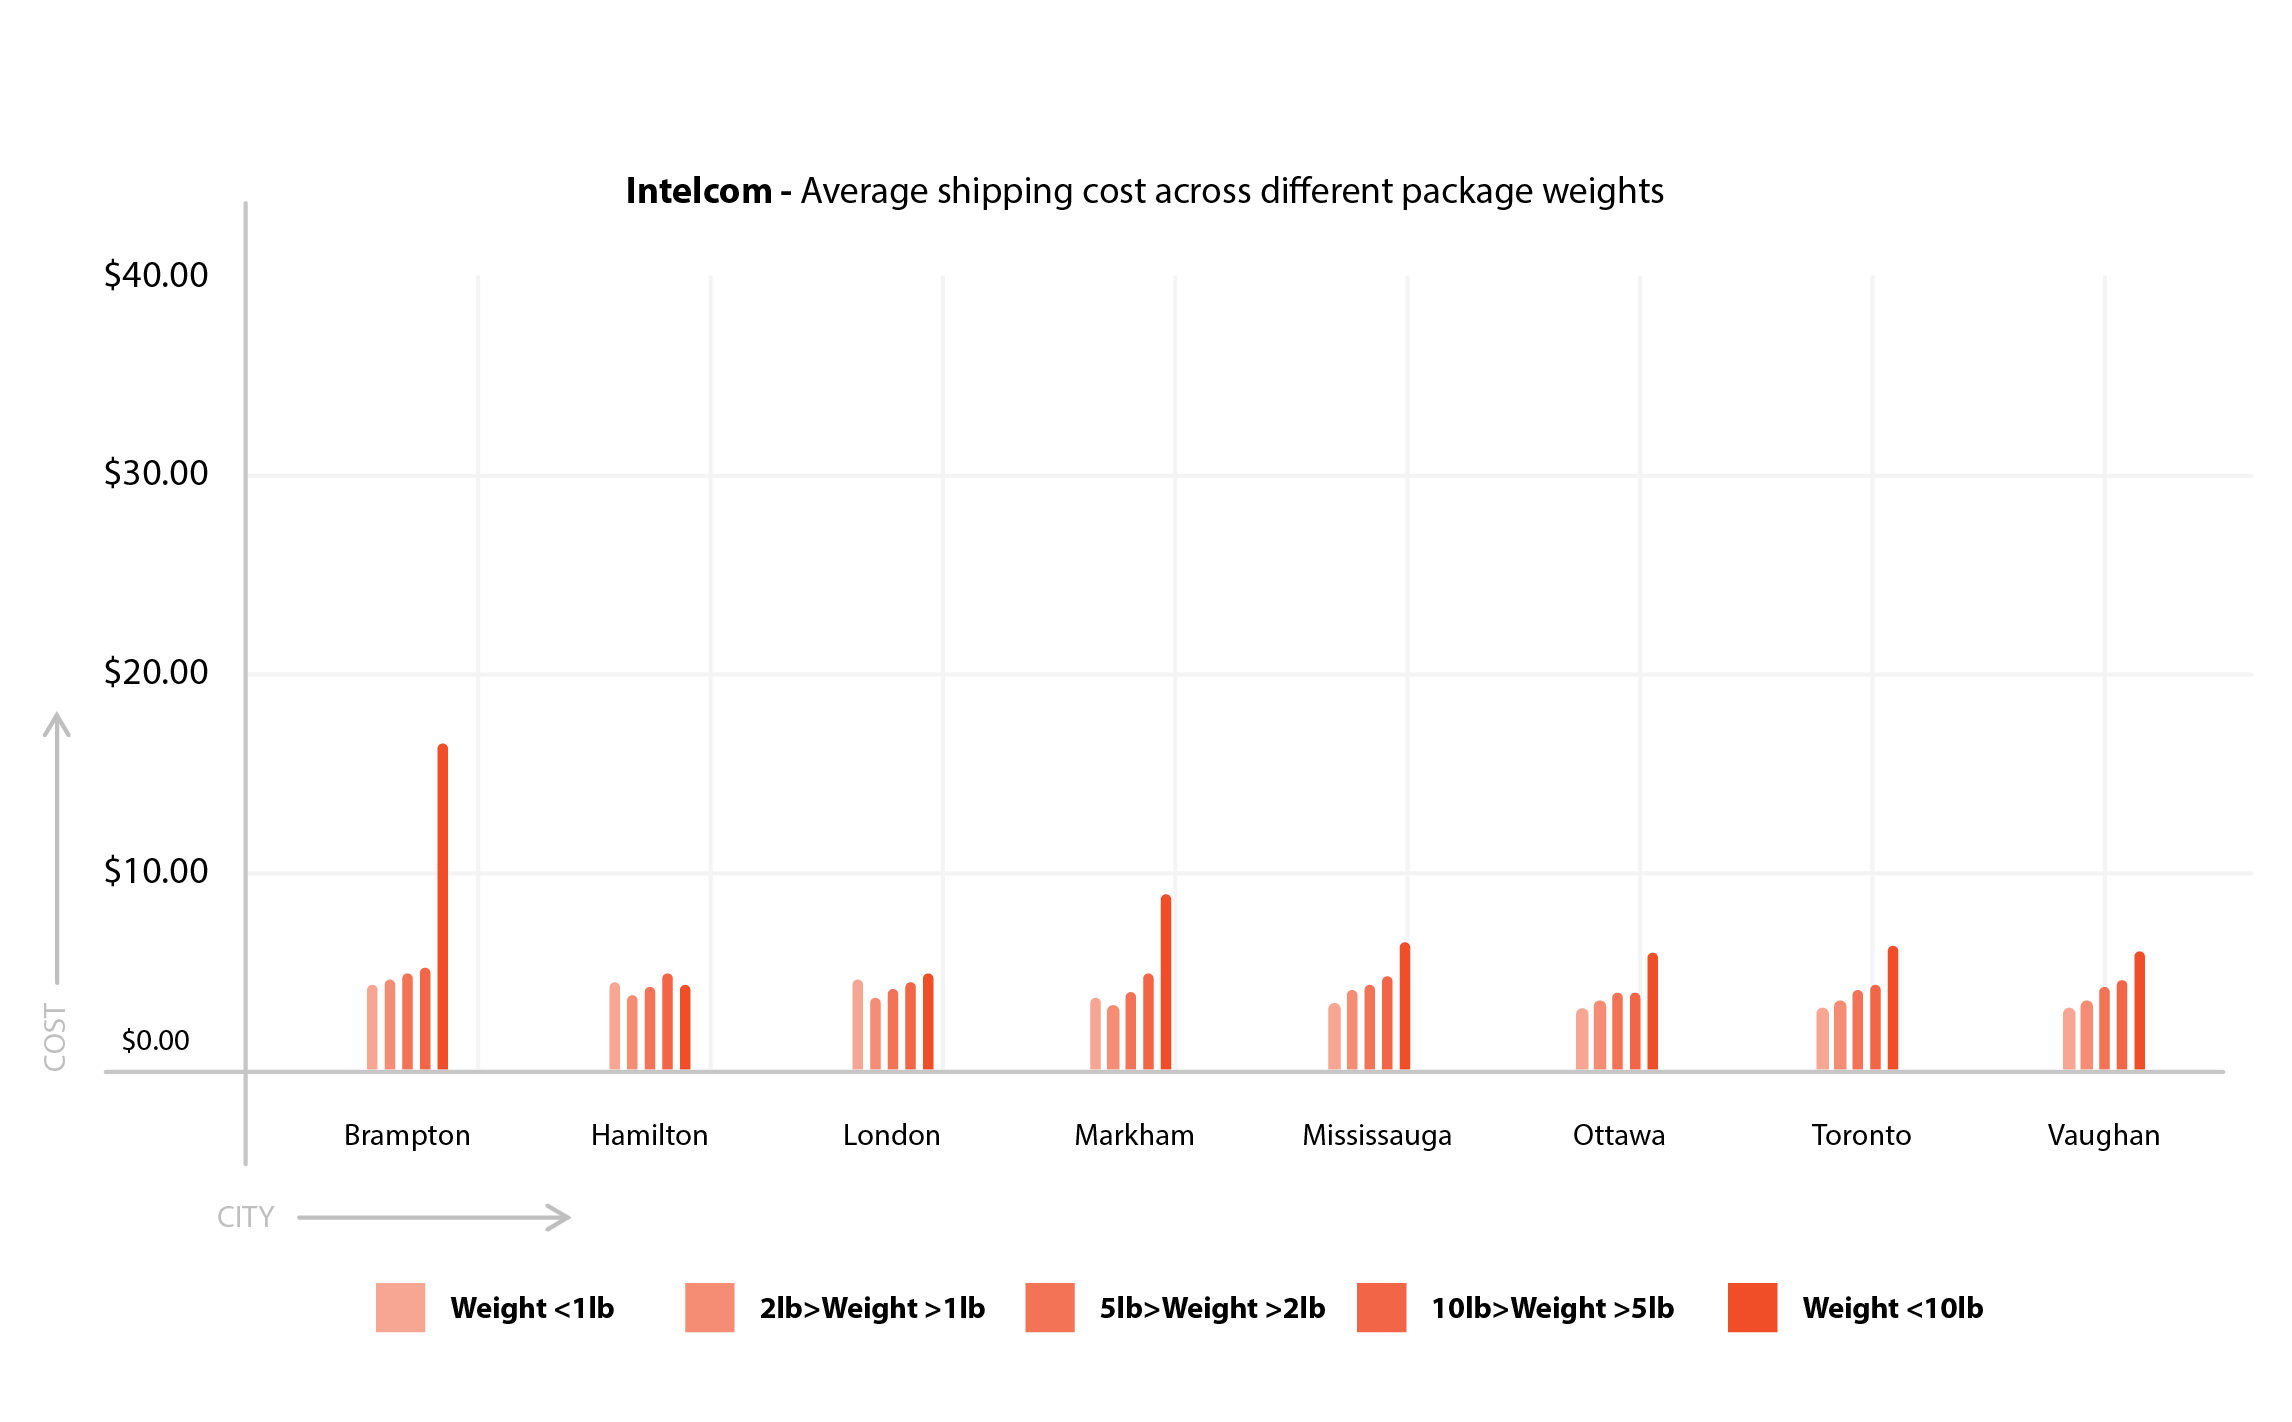
To help Canada based businesses to make a data-backed decision, we have created this objective report assessing shipping carrier’s performance. Since shipping cost plays a big role when zeroing on a shipping carrier, we have calculated the average shipping cost across different package weights.
Note: For the purpose of this report, we have considered the time frame between October 1st, 2020 & December 31st, 2020. We are also targeting top 10 populous cities in Canada for a meaningful dataset analysis.
Shipping experience score
Shipping experience score is a score based on collective performance across different critical factors that are used to evaluate a shipping carrier’s perfomance. Shipping carriers performance cannot solely be based on speed or cost. There is an increasing demand from end-customers to have a greater visibility in to their shipment journey or faster response to their where is my order queries.
Taking these factors into account, Intelcom has shipping experience score of 96%, Canada Post has a score of 83.6% and
UPS has a shipping score of 90%.
 Delivery timeline
 On-time delivery performance
 Shipping cost
![]() Tracking visibility
Tracking visibility
 Customer support
![]()

![]()
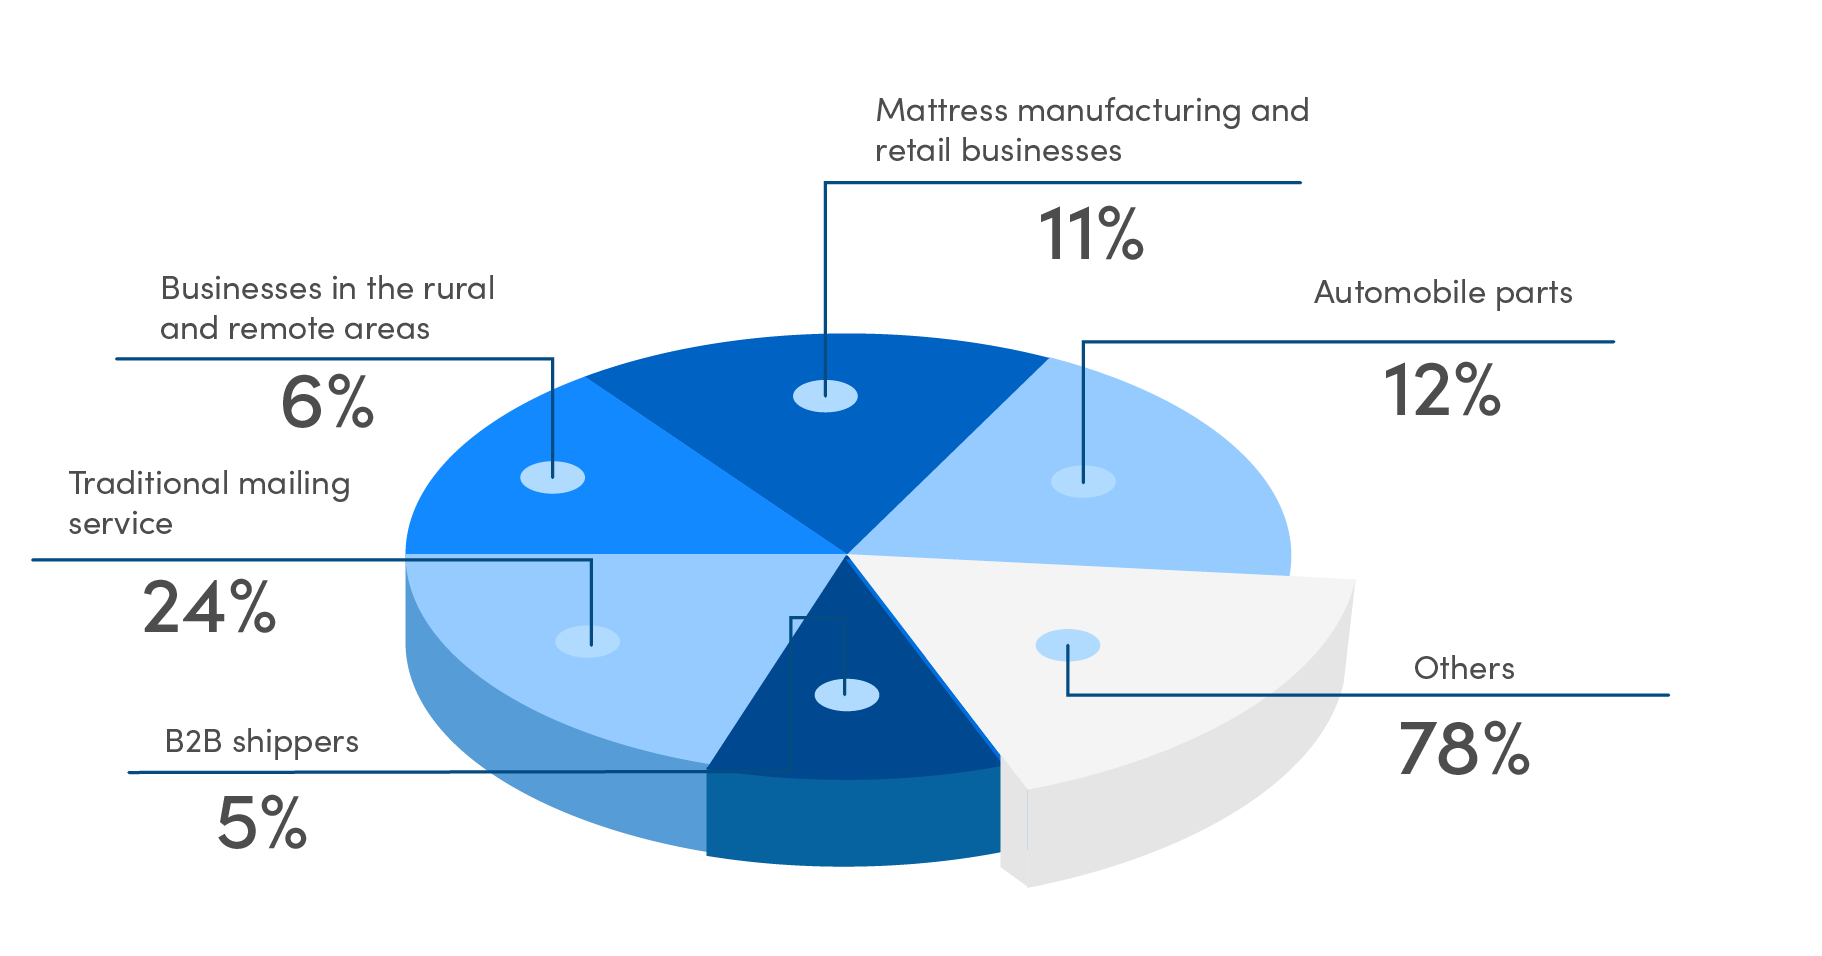
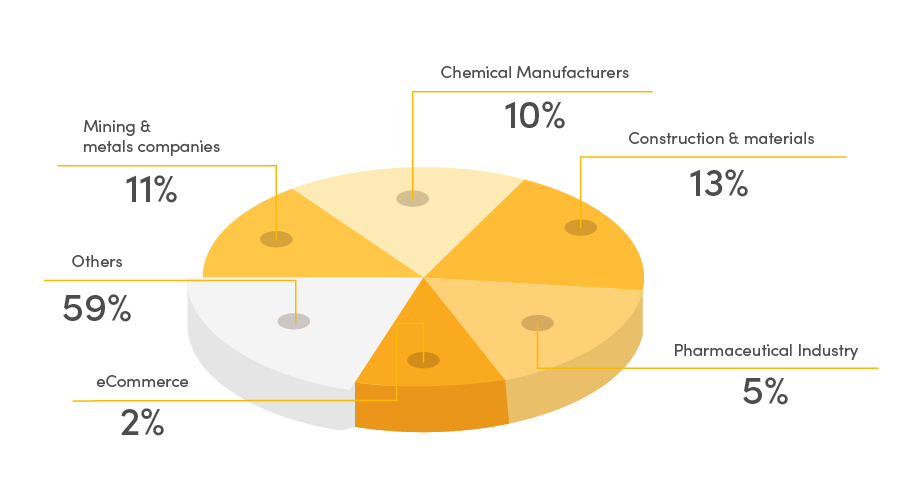
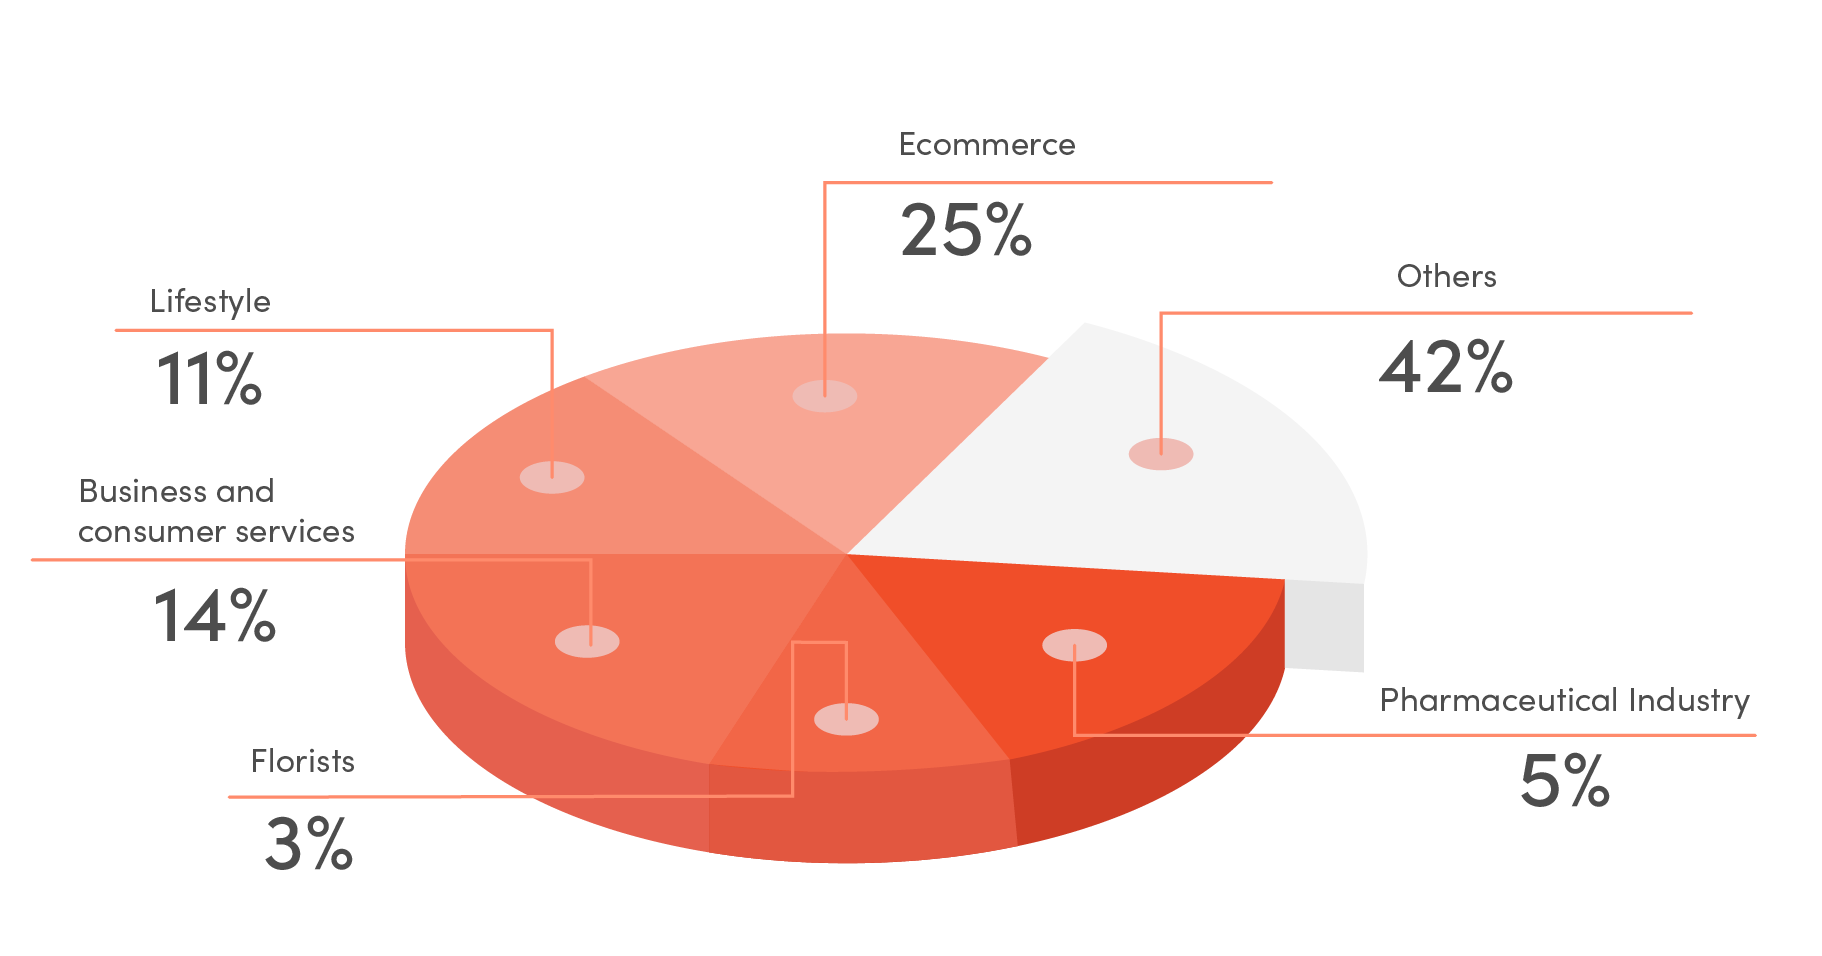
Traditional Industries Are Loyal To Canada Post While ECommerce Prefer Intelcom & UPS
It comes as no surprise, that traditional businesses like mattress and B2B shipping services still continue using Canada Post. Most industries that need to ship hazardous material choose UPS along with a small percentage of eCommerce businesses. Although a significant number of eCommerce businesses ship with Intelcom largely due to same day delivery capability.
![]()
![]()
Delivery performance assessment of shipping carriers
Both UPs and Intelcom have a superior delivery performance when compared to Canada Post. In certain cities like Hamilton, Mississauga and London, Intelcom outshines UPS. Intelcom delivers most shipments on the same day. While UPS delivers within a 1-2 time window, Canada Post shipments are delivered on an average in 4-6 days. For the purpose of this report, we have aggregated the shipping information for the most populous cities in Canada.
Comparison of average delivery time across most populous cities
Carrier wise breakdown of delivery time
| City | Canada Post Avg Shipment Delivery Time (Days) | Intelcom Avg Shipment Delivery Time (Days) | UPS Avg Shipment Delivery Time (Days) |
|---|---|---|---|
| Brampton | 4-11 | 1 | 1 |
| Hamilton | 3-4 | 1 | 2 |
| London | 3-4 | 1 | 2 |
| Markham | 4-8 | 1 | 2-3 |
| Mississauga | 3-5 | 1 | 2 |
| Ottawa | 2-5 | 1 | 1-2 |
| Toronto | 3-8 | 1 | 1 |
| Vaughan | 3-5 | 1 | 2-3 |
| Laval | 2-5 | 1 | 2 |
| Montreal | 2-7 | 1 | 1-2 |
Evaluation Of Shipping Cost Based On Different Package Weights
In order to effectively capitalize on delivery speed, it is important to analyse the shipping cost. The average shipping cost of Canada Post packages across different shipment weights is depicted here
Canada Post - Average Shipping Cost Across Different Categories of Package Weight
In case of UPS, for packages shipped to cities like Laval, Montreal and Ottawa the average shipping cost exceeds to that of Canada Post. ( Indicated by negative percentage)
UPS : Percentage of Average Cost Savings When Compared To CanadaPost
| City | Weight < 1lb | 2lb > Weight > 1lb | 5lb > Weight > 2lb | 10lb > Weight > 5lb | Weight > 10 lb |
|---|---|---|---|---|---|
| Brampton | 6.96% | 0.87% | 2.61% | 5.04% | 32.40% |
| Hamilton | 4.64% | 0.62% | 17.36% | 10.40% | 16.31% |
| London | 1.71% | 2.15% | 1.42% | 4.86% | 64.14% |
| Markham | 2.04% | -6.34% | -3.92% | -10.30% | -18.83% |
| Mississauga | 16.66% | 11.47% | 11.73% | 28.16% | 65.13% |
| Ottawa | -10.21% | -10.77% | -8.25% | 0.98% | 59.40% |
| Toronto | -10.25% | 1.67% | 16.50% | 28.15% | 33.26% |
| Vaughan | 1.60% | 11.16% | 17.38% | 30.42% | 50.53% |
| Laval | -13.70% | -7.00% | 11.07% | 18.11% | 37.60% |
| Montreal | -17.44% | -9.36% | 2% | 27.57% | 24.08% |
On the other hand, the percentage of average cost savings of Intelcom shipments over Canada post across different parcel weights is approximately
37% - 65%
Intelcom : Percentage of Average Cost Savings When Compared To CanadaPost
| City | Weight < 1lb | 2lb > Weight > 1lb | 5lb > Weight > 2lb | 10lb > Weight > 5lb | Weight > 10 lb |
|---|---|---|---|---|---|
| Brampton | 60.30% | 66% | 69% | 68% | 44% |
| Hamilton | 61% | 60.15% | 71.20% | 63.50% | 71.90% |
| London | 65.60% | 67% | 66% | 70.70% | 87.50% |
| Markham | 61.80% | 63.14% | 58.90% | 55.70% | 16.11% |
| Mississauga | 62.11% | 61.36% | 65.80% | 69.70% | 80.12% |
| Ottawa | 61% | 64.80% | 62.60% | 68.36% | 82.36% |
| Toronto | 61.30% | 63.40% | 66.50% | 68.50% | 65.12% |
| Vaughan | 54.35% | 60.50% | 65.90% | 69.10% | 79.40% |
| Laval | 41.21% | 42.45% | 43.86% | 35.59% | 38.19% |
| Montreal | 45.98% | 48.96% | 42.55% | 40.68% | 35.79% |
About the report
The ultimate goal for any business that ships are to increase delivery speed and decrease shipping costs. Delivery experience has become central to establishing a brand’s reputation.
Evaluating shipping carriers’ performance objectively is critical while taking decisions to optimize and increase the efficiency of the organization’s last-mile delivery experience. Many organizations resort to ineffective last-mile strategy due to the unavailability of a single source of truth for delivery performances.
To offer businesses more visibility into shipping, ShippingChimp has compiled this objective report taking into account over 100,000 packages shipped through Canada Post and Intelcom in the period between October 2020 & December 2020 originating primarily around Ontario and Quebec provinces.
The report was produced in partnership with Reliable logistics Canada.
* The information in the document has been printed on the basis of publicly available information; internal data and other sources believed to be true and are for general guidance only. While every effort is made to ensure the accuracy and completeness of information contained, the company takes no responsibility and assumes no liability for any error/ omission or accuracy of the information..