Why Guess When You Can Know?
In Canada, there are 29 million online shoppers. e-commerce now represents 11.5% of Canada’s total retail sales. One of the most expensive parts of eCommerce is shipping. Shipping is more than just moving packages—it’s a crucial part of your customer experience, profitability, and growth strategy. But without the right data, you’re making blind decisions.
What if you could see exactly where your shipping dollars go, how fast your deliveries arrive, and which regions need better logistics? Sounds like a dream.
That’s exactly what ShippingChimp’s analytics does for you. From month-over-month shipping trends to province-specific performance in Canada, the U.S. (if you ship cross-border), and the U.K. (if you ship internationally), ShippingChimp gives you data-driven logistics.
The Big Picture: Month-Wise Shipping Performance
Are your shipping costs going up or down? Are deliveries getting faster or slower?
With month-over-month shipping reports, you get a birds-eye view of your logistics.
What You’ll See:
Total Packages Shipped Per Month – Spot seasonal trends and peak shipping periods.
Total Shipping Costs Per Month – Track budget fluctuations and identify cost-saving opportunities.
Average Cost Per Shipment – Compare how much you’re spending per order over time.
Average Delivery Time Per Month – Monitor whether your shipping speeds are improving or declining.
Why It Matters:
These reports help you forecast demand, optimize your budget, and avoid surprise costs. No more wondering why shipping expenses spiked—now you’ll know.
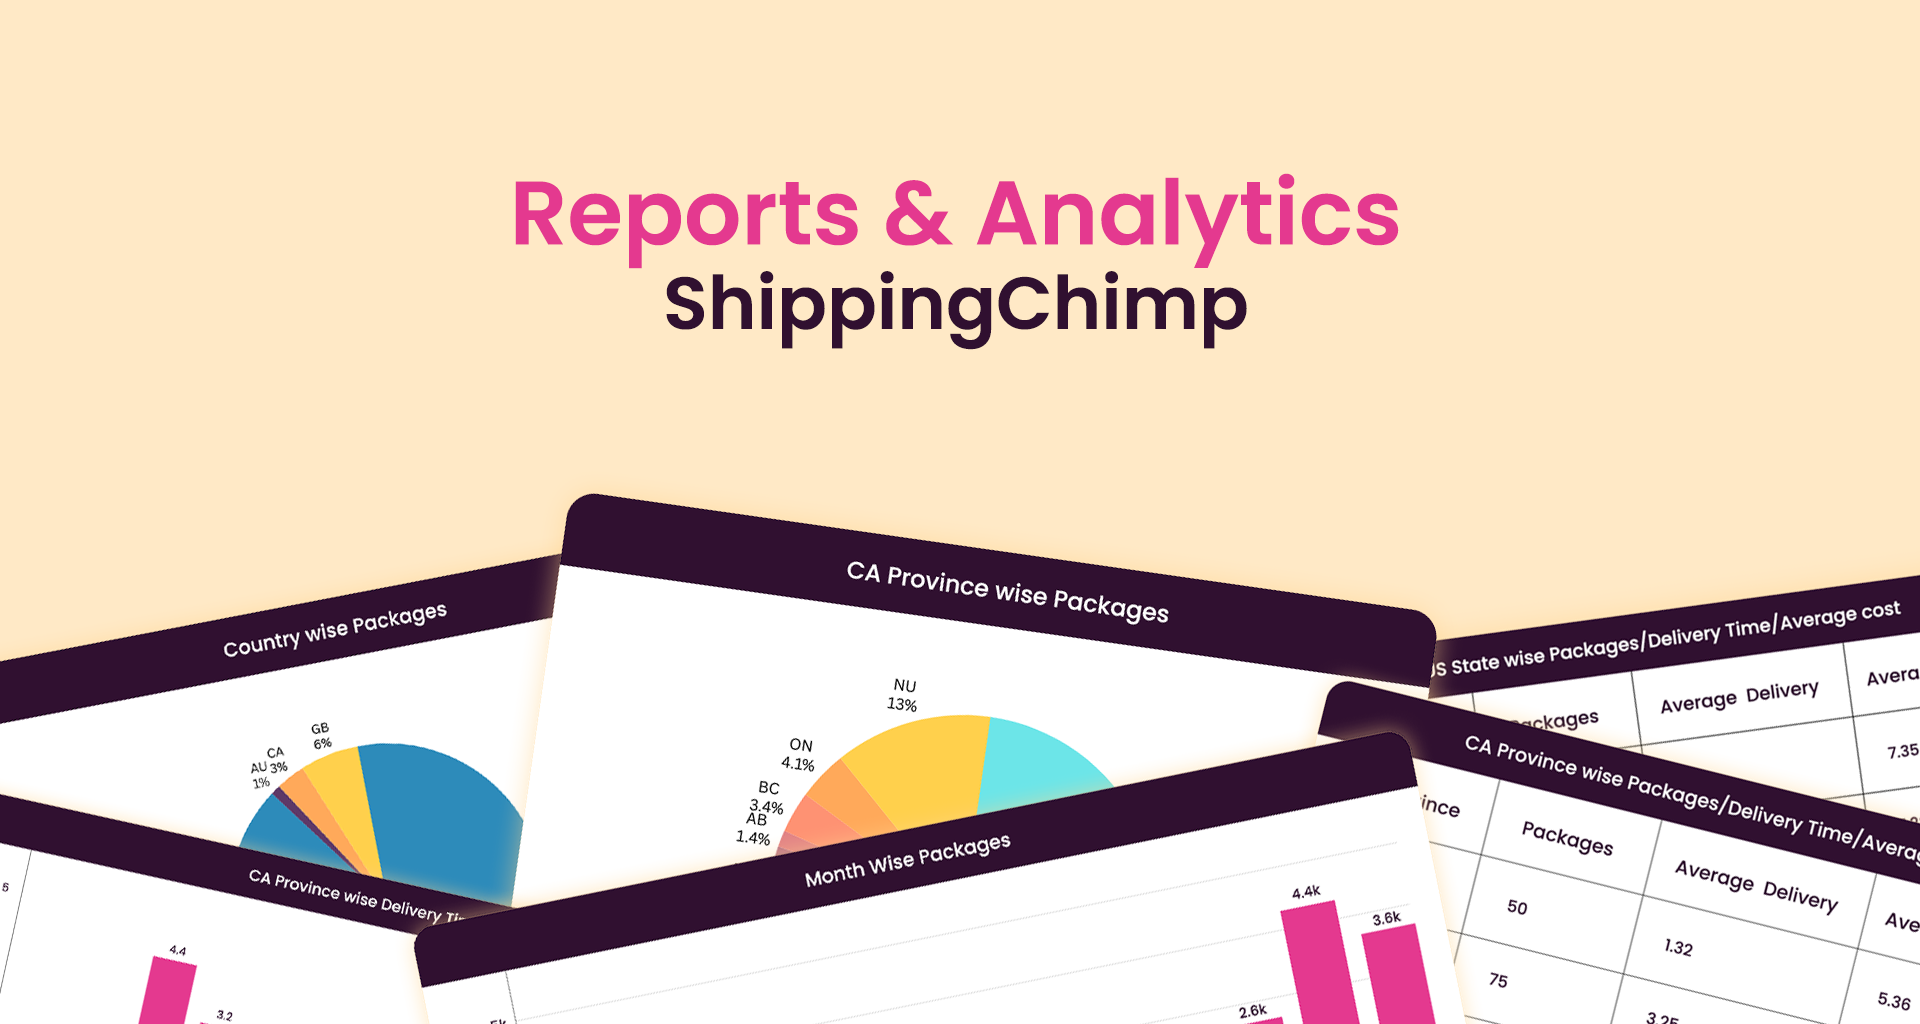
The Canada Report: Where Are Your Packages Going?
Which provinces get the most shipments? Where are deliveries fastest (or slowest)?
If you ship across Canada, you need to optimize fulfillment, reduce costs, and ensure fast deliveries in key regions.
What You’ll See:
Total Packages Shipped by Province – Identify high-demand regions.
Average Delivery Time Per Province – Find out where deliveries are smooth and where they need improvement.
Average Shipping Cost Per Province – Compare costs across different areas.


Why It Matters:
This data helps you identify the top performing provinces, adjust fulfillment strategies, and ensure smooth delivery across Canada.
The U.S. Breakdown: Your State-by-State Shipping Playbook
Which U.S. states bring in the most sales? Where do you need faster deliveries?
Around 34% of e-commerce purchases originate from abroad, mostly from the US and China. If you are Shipping to the U.S., your customers expect fast, reliable deliveries, and your costs can skyrocket if you’re not tracking them carefully.
What You’ll See:
Total Packages Shipped Per U.S. State – Pinpoint your best-performing locations.
Average Delivery Time Per State – Identify slow regions.
Average Shipping Cost Per State – Spot high-cost areas and improve pricing strategies.

Why It Matters:
Knowing which US states drive the most sales allows you to optimize cross-border shipping, and identify where you are lacking.
Mastering International Shipping
With ShippingChimp, you can ship to anywhere with the world. Our eCommerce-friendly rates allow Canadian eCommerce businesses to expand beyond the US. This is why our reports include insights on Canada shipping, US shipping and international shipping – to give you a detailed analysis of what’s happening with your shipping.
Let’s take the UK as an example. Over the 2024-2028 period, eCommerce sales in the UK are expected to be largely driven by food, beverage, apparel, and footwear products. However, international shipping comes with its own challenges. If you ship internationally, from Canada to the UK, these are the reports you will come across.
What You’ll See:
Total Packages Shipped by U.K. Region – Understand regional demand.
Average Delivery Time Per Region – Improve last-mile delivery efficiency.
Average Shipping Cost Per Region – Control costs while maintaining fast shipping.

Why It Matters:
This data helps eCommerce brands fine-tune their international shipping strategy, reduce costs, and ensure fast, reliable delivery to U.K. customers.
Why You Need to Start Using These Insights Today
ShippingChimp’s analytics doesn’t just give you numbers—it gives you the information you need to make your delivery experience better.

Use these reports to:
Cut shipping costs by tracking province/state-specific expenses.
Improve customer satisfaction with faster deliveries.
Scale your business with data-backed shipping strategies.
Stop guessing. Sign up for ShippingChimp today and turn your shipping data into your most effective eCommerce strategy.


- What is SKU? A Complete Guide to Stock Keeping Units - March 18, 2026
- How to Write a Canada Post Address Correctly? - March 5, 2026
- Flat Rate Shipping: What It Is and How to Use It to Grow Your Store - March 2, 2026


